
Total cost of ownership
What a vehicle really costs, per vehicle and across the fleet.
Total cost of ownership is everything a vehicle costs for as long as you keep it, not the finance payment alone. CarCloud builds the number from what you actually spend, fills the gaps with figures for vehicles like yours, and carries it forward twelve months, so replacement, refinancing and budgeting are decided on a real figure.
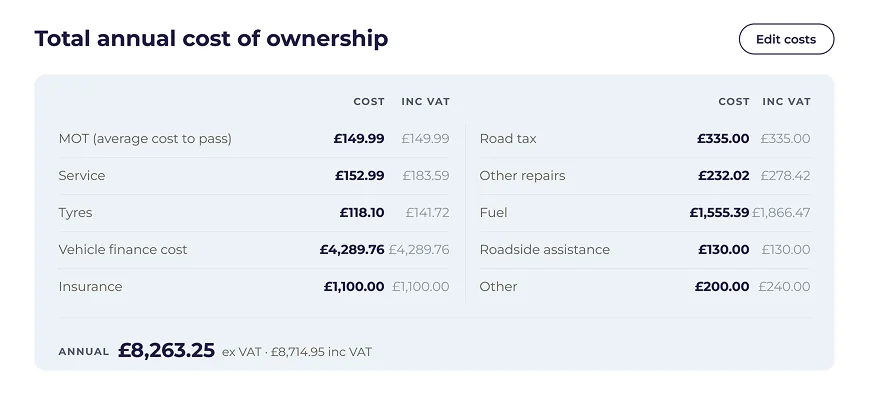
From the CarCloud platform
What goes into the number
Every line, including the ones people leave out of the sum.
Most organisations know the finance or lease payment and the fuel bill. The total is usually far higher, because the rest arrives from different suppliers on different schedules and never gets added up against the vehicle.
Finance or lease
The monthly payment, plus what is still owed against what the vehicle is worth.
Fuel or charging
Allocated to the vehicle at the point of payment, not averaged across a fuel card.
Insurance
The premium, and the excess when a claim is made.
Servicing and repairs
Scheduled servicing, the repairs nobody planned for, and tyres.
Tax and MOT
Small on their own. Expensive when missed.
Depreciation
The value the vehicle loses while you own it, from a live market valuation rather than an assumed one.
How the number is built
Actuals first. Modelled where there are none. Forecast twelve months ahead.
01
Actual spend
Payments, invoices and mileage claims attached to the vehicle that incurred them, so the record is what was spent, not what was budgeted.
02
Modelled where needed
Where a line has no actual yet, CarCloud uses national figures for that make, model, age and fuel, rather than one average for every vehicle on the road.
03
Forecast forward
The next twelve months, per vehicle and across the fleet, so a £500 service in March is something you knew about in January.
One figure, comparable across the fleet.
Because every vehicle is costed the same way, the fleet-wide view is a report rather than a spreadsheet exercise: which vehicles cost most, which cost more than they should, and which to replace first.

Know what each vehicle really costs before you decide what to do with it.
Actuals plus forecast, twelve months ahead, for every vehicle in the fleet.
Across the fleet
The vehicles that cost more than they should, in one list.
The per-vehicle figure is useful. The fleet view is where the money is: the same eight lines totalled across every vehicle, ranked, and compared with what a vehicle of that type should cost.
That is where replacement timing, refinancing and insurance renewals stop being reactions and become decisions, which is what the calculator estimates before you have the data and CarCloud shows you once you do.
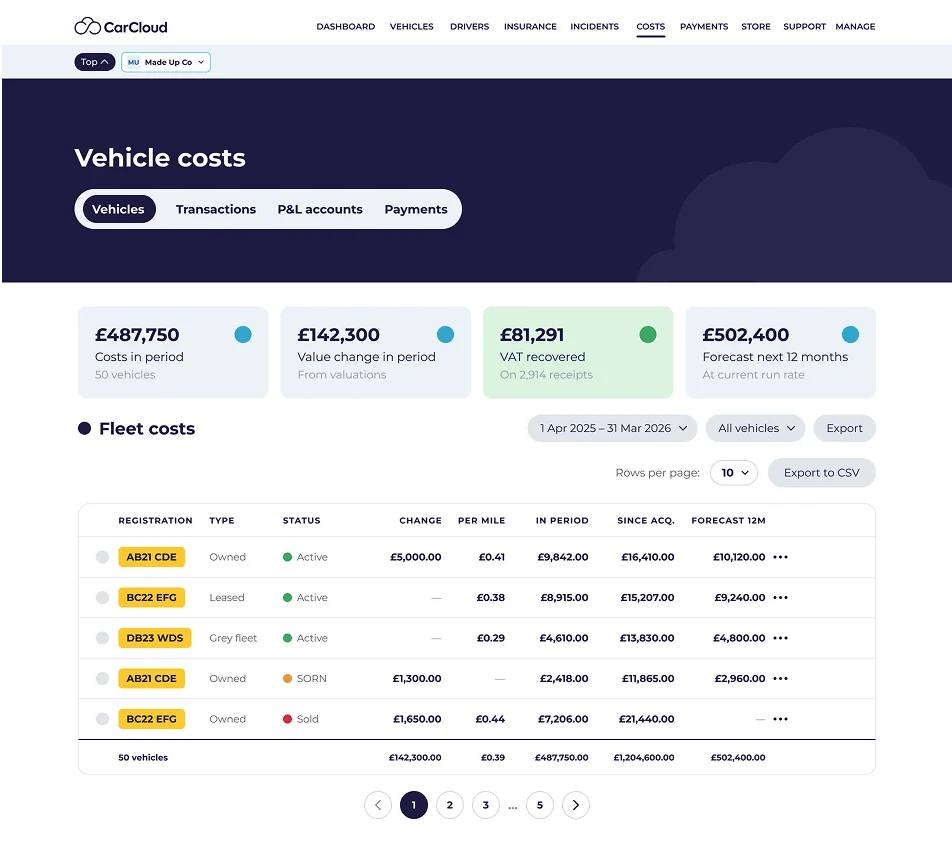
From the CarCloud platform
What changes
Decisions become data-led.
Budgets are built from actual spend rather than last year plus a percentage. Vehicles are replaced on cost and condition rather than age. And the question “what does this vehicle cost us?” has an answer that survives the person who used to keep the spreadsheet.

Drive your business with CarCloud DRIVE.